
Casweb Guide
Extracting data from Casweb is a three step process. Follow the links in the navigation for help with this process. Please note that this guide is for 2001 census. Casweb works slightly differently for the earlier censuses.
Step 1: select area
Follow these steps to define your study area:
1a: Define Study Area
- First you need to select one of the censuses, lets select 2001 Aggregate Statistics Datasets.
- In this example we want to extract data for Birmingham. So we would select England and then click Select lower geographies.
- Now you need to define the region of interest, which in this case is West Midlands. Select West Midlands and then Select Counties to view the lower level zones. Lets select 3 counties: 2E (West Midlands), 41 (Staffordshire) and 47 (Worcestershire). Select these Counties and then click on the Select Districts button.
- Your list should now consist of 21 Districts. Look carefully through the list and select the 6 Districts constituting the study area (ie Birmingham, Solihull, Lichfield, Tamworth, Bromsgrove, Redditch). We have no need to define the study area at lower zones because we wish to extract ethnicity data for all wards within these 6 Districts. Now you are ready to select the output level.
1b: Define Output Geography
- When you're happy with your District selection, press Select output level ....
- As we are interested in CAS wards, click the CAS Ward radio button in B Select Output geography and then press the Select data... button.
To recap, you have started at the highest geographical level, worked your way down by refining your area to 6 Districts and then chosen to output data for all CAS wards in those districts. Now let's choose some data!
Step 2: select data
Census data are held at CDU in tables, within datasets which are listed. By default, the Key Statistics dataset (the first in the list) is selected. If another dataset is currently selected, then click the radio button next to Key Statistics and Select Dataset. Available tables for that dataset are listed at the bottom of the page.
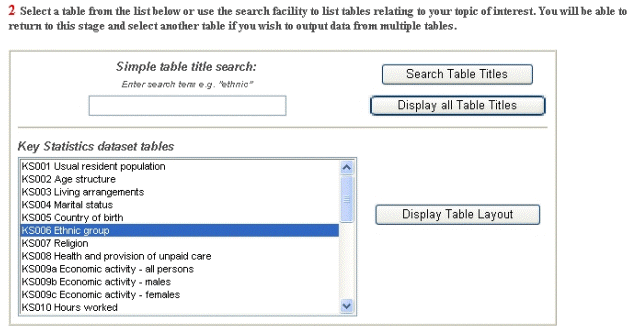
Each table has a code associated with it - for example, "KS002" is the Key Statistics table showing the age structure of all people. Because it's quite hard to work out what "KS002" means by just looking at the code, Casweb supplies two easy ways to find out which table you want: searching and picking. The search option is easy to use so we'll go through the "picking" option to choose Ethnic group for the wards in the districts you defined as your study area, as detailed in the steps below:
-
After you pressed the Select data... button, you would have seen the following form appear on your screen:
-
Scroll down the list of tables until you find KS006: Ethnic groups.
-
Click the Display Table Layout button.
Key Statistics table 6 appears with the definition that the table contains counts of persons. You are wanting to extract data for the 5 broad groups: White, Mixed, Asian, Black and Chinese/other. The table gives ethnicity information for the more detailed 16 groups so, after extraction, you will need to carry out some simple aggregation of data in your spreadsheet.
-
Select the Select All button and all the boxes will be checked.
-
On the right of the screen you will notice that in the variable list it says No variables selected. Pushing the Add variables to data selection button will add the data you picked to the list of variables. Do this now and notice how the variables are listed as codes, for example KS0060001. At this stage you may find it useful to rename the variables with the column headings from the table. Highlight the first variable KS0060001 and click Rename. Enter the new name for the variable All people and select OK. The variable list will now automatically update.
Note: Some browsers may disallow the script - resulting in the rename box not appearing. If this happens take a look below the address bar and click to allow the script. -
Do this for the other 16 variables.
By default the zone attributes selected are zone code and zone name.
-
Now that we've selected the variables you are interested in, you can now download the data. Click the Get Data button as shown below:
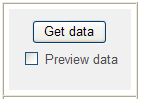
Casweb will then process your request.
Step 3: Output data
You are now in the final stage of data extraction.
Complete these remaining steps:-
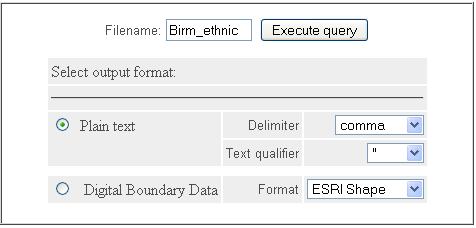
The data downloads option page will now appear. You can type a name into the filename box (if you do not type in a name the file will be names download).
-
You can either download the data in plain text (ie the census aggregate data), or as Digital Boundary Data (DBD). DBD is a computer readable map of the outlines of the geographic zones together with the census aggregate data that you have selected. If you choose this option then you will need GIS software (e.g. ArcGIS or MapInfo)
-
In this example we will just dowload the data in plain text
format. The default files produced by Casweb are in CSV (Comma
Separated Variables) format. This just means that Casweb uses
commas to separate columns of variables and it can be imported
easily into Excel. Note that you can change this to tabs, spaces
or semi-colons.
-
For this exercise, let's enter Birm_ethnic as the filename and
leave the other options as defaults. Then push the
Execute query button to generate the file.
- After a brief wait, Casweb will show you a final button saying Download data file: and then the filename. Click on it and save the file to your computer. If you look at the contents of the file you have downloaded you will see that there are 127 wards in your study area.